Introduction
Australia’s residential property market and the fundamentals that impact price movements over time are influenced by a convergence of macroeconomic, demographic, and financial megatrends. These shifts are reshaping how Australians live, invest, and interact with residential property. This paper will delve into five key megatrends impacting Australian residential property.
By analysing these trends, we aim to provide valuable insights for investors, policymakers, and industry professionals to navigate the evolving market dynamics. Understanding these megatrends is essential for adapting strategies, mitigating risks, and capitalising on the investment opportunities shaping the future of Australian residential property.
Market size
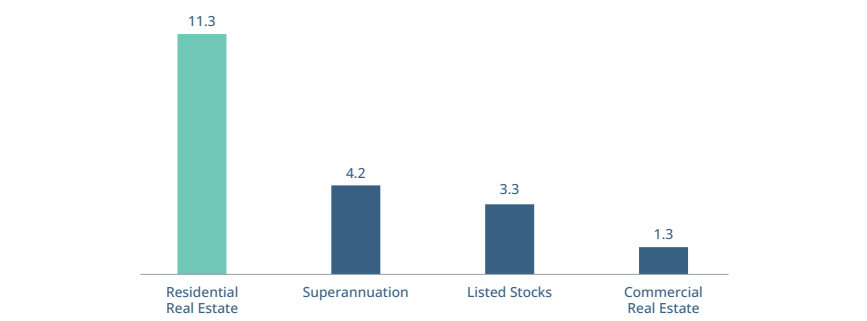
From a fundamental market approach, it is first worth understanding the size of the Australian residential property market, and how it compares to other asset classes.
The housing market in Australia is currently valued at A$11.3T making it around 3.5 times larger than the ASX and eight and a half larger than the commercial real estate sector locally. While not an asset class in the purest definition of the word, the residential housing market is over two and a half times larger than Australia’s superannuation sector.
Of the A$11.3T, A$7.9T is owner occupied, and the remainder is held by property investors. Residential property accounts for 70 per cent of household wealth and is systemically important to our major financial institutions. Around 60 per cent of the loan books of the big four banks are made up of mortgages.
Australian Asset Class Allocation ($, Trillion)1

Historical returns across key cities
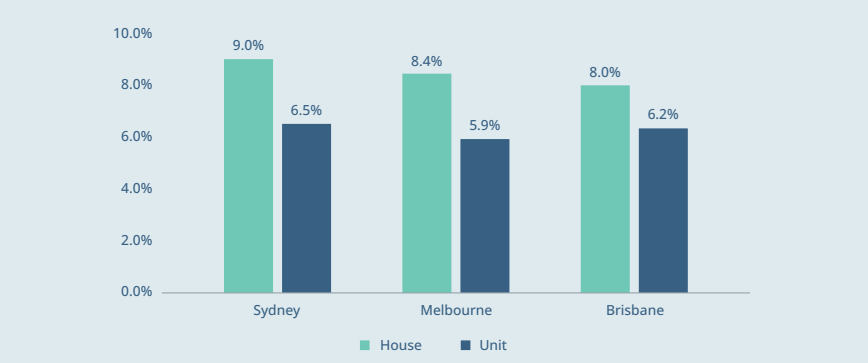
As we consider where property prices are taking us into the future, it can be helpful to see where we have come from. The chart below documents the average capital growth returns of the past 50 years across Sydney, Melbourne and Brisbane2. We can see houses have delivered high single digit returns, while units, which have a slightly shorter data collection period, have delivered mid-single digits.
Average capital growth returns – last 50 years
The question is, can this growth continue?
Megatrends
At HOPEi, we’ve identified five megatrends we predict will drive Australian residential property price growth over the next decade. We believe they will benefit both owner occupiers and investors alike, however access models to the asset class will also have a part to play in how these trends are ultimately captured by investors.
These five megatrends are:
- demographics
- population growth
- wealth transfer
- government policies
- supply and demand characteristics.
1. Demographics
There are two sub-trends that are worth exploring within the demographic megatrend, and these are:
a) female participation in the workforce; and
b) delaying retirement.
a) Female participation in the workforce
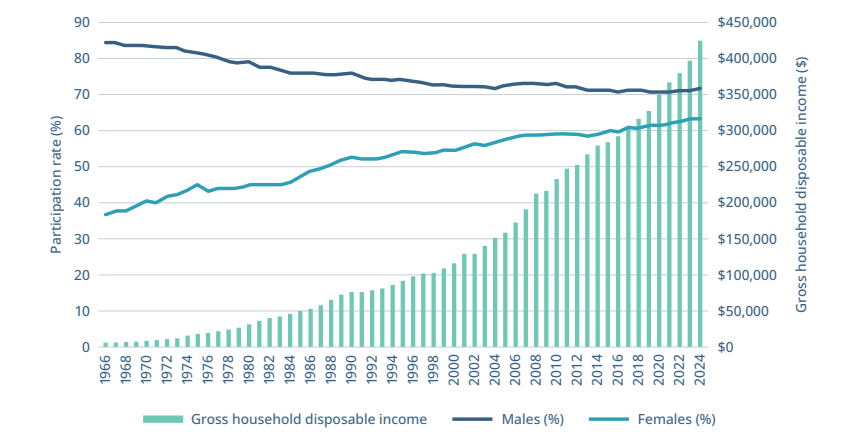
Over the past four decades, increased participation of females in the workforce has dramatically changed the gross household income profile in Australia (chart below) . During this same period, female participation3 rates increased by 20 percent. This has had a flow-on effect on household borrowing power, enabling larger mortgages for longer for Australian families. At HOPE, we see a continued increase in gross household income and borrowing power as the gender pay gap closes.
Change in labour force participation rate & household income

b) Delaying retirement
A second demographic trend is the rise in Australians delaying retirement. As healthcare has improved, alongside average lifespans, Australians are choosing to remain in the workforce for longer. Forty-seven percent of Australians over 55 cite financial security as their driver to remain working, while 59 percent plan to reskill, or seek additional training4,5.
Australians living and working for longer
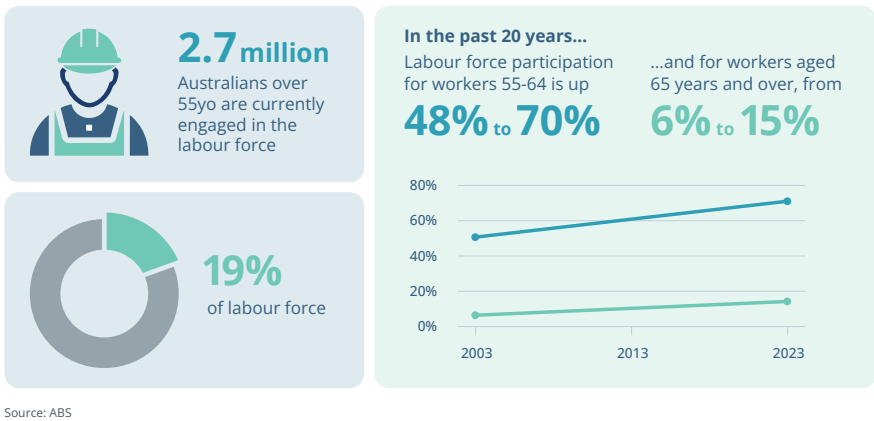
This working for longer trend is a supporting factor of household borrowing and servicing ability, with cashed- up older Australians also continuing to consider property investment as a safe means of storing wealth.
2. Population Growth
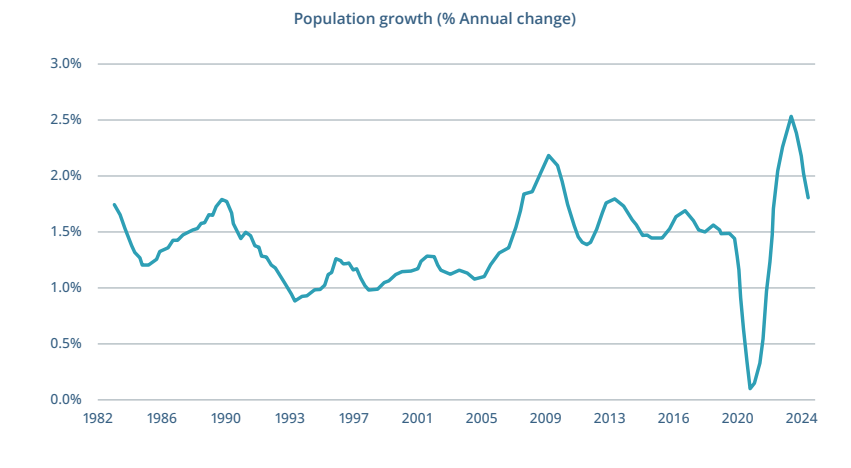
Australia has had high population growth for decades, driven by migration. The average growth rate for the twenty years to 2024 in Australia was 1.4 percent6. This may not seem like a significantly high number, but if we draw comparisons over the same twenty-year period – New Zealand grew at 1.1 percent, the US grew at 0.9 percent and the UK at 0.4 percent. That is 1.5 times the US and more than three times the UK.
Annual population growth in Australia (1981-2024)
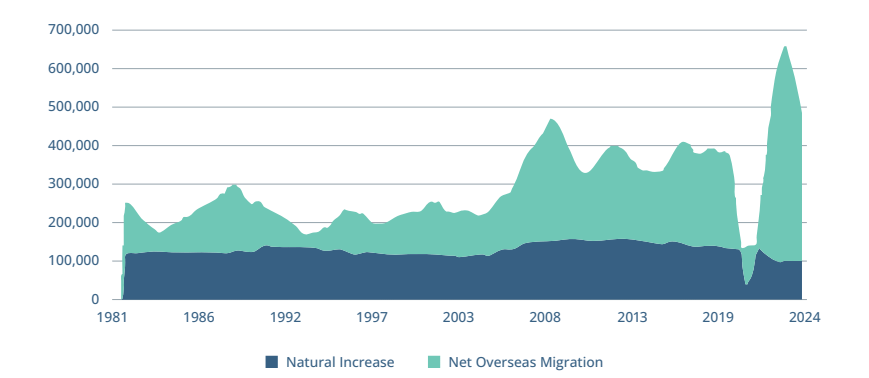 In recent years, the Australian population growth rate has hit fresh highs, driven by net overseas migration. And with people migrating for career opportunities, access to great healthcare and a superior education system, there is little evidence to suggest that this growth rate will not continue.

3. Wealth Transfer
There is a forecast A$5.4T in baby boomer assets which are set to be inherited by Millennials and Gen Z by 2034, and a significant proportion of this wealth will be re-leveraged into property7.
Wealth Transfer
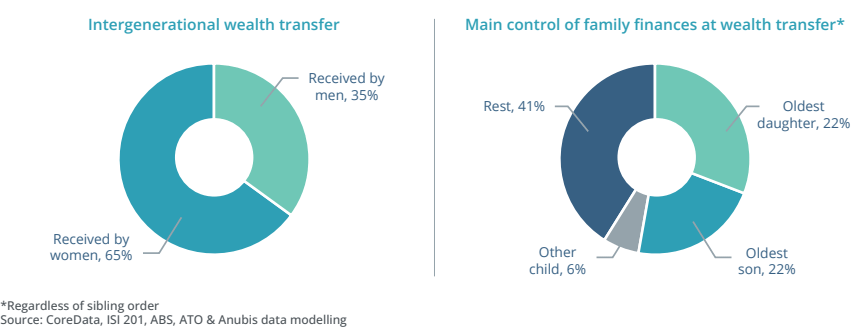
Unlike in several advanced economies, Australia has no inheritance tax, and this will ensure that this transferred capital is preserved. What our research shows is that the rates of living inheritance have been increasing – in essence older generations are now financially supporting younger generations while they are still alive. The chart below shows that, at its peak, 60 per cent of first home buyers received financial help from their parents, demonstrating the increasing rate at which wealth is being transferred through living inheritances.
Living inheritance rates increasing
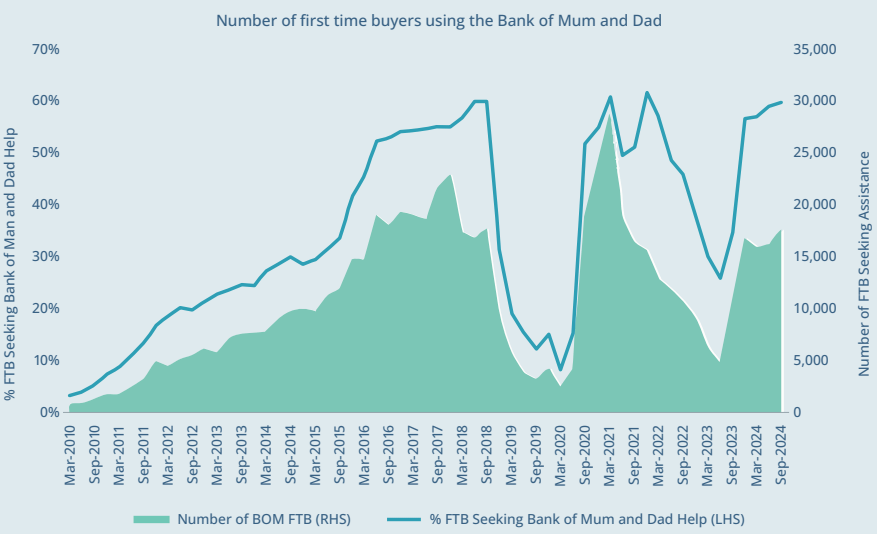
Further data in 2024 from Digital Finance Analytics shows that the ‘Bank of Mum and Dad’ is now morphing into the ‘Bank of Grand Parents’ or even the ‘Bank of the Extended Family’, as the challenge of first homeowners entering the market deepens.
With a large intergenerational wealth transfer on the horizon (arguably already underway) and being leveraged into the property market, we think this will continue to push house prices higher.
4. Supportive tax, government policies and banking system
Housing is a protected asset class, with governments unwilling to implement major reforms or changes to tax settings that will impact homeowners, investors or banks negatively.
There are favourable tax settings for homeowners – across CGT, land tax and stamp duty. Homeowners are relatively shielded from tax setting changes in relation to housing, with property investors more likely to feel the brunt of land-tax hikes and political noise related to negative gearing and rent-caps – and this has been the case for east coast states over the last 12 months.
Furthermore, data from AMP and the ABS shows 70 percent of household wealth in Australia is tied to property, and voting Australians are politically sensitive to any broad-based policy changes that threaten this9.
The chart below highlights the supportive govt policies, with Housing Australia data showing that there were 35,000 First Homeowner Guarantees issued in 2023-24, supporting more than 41,700 Australians to purchase a new home10,11. The final point to note is that mortgages are the bread and butter of the Australian banking system – 60 percent of the total loan book of CBA and Westpac are home loans.
Supportive policies and mortgage dependent banking system
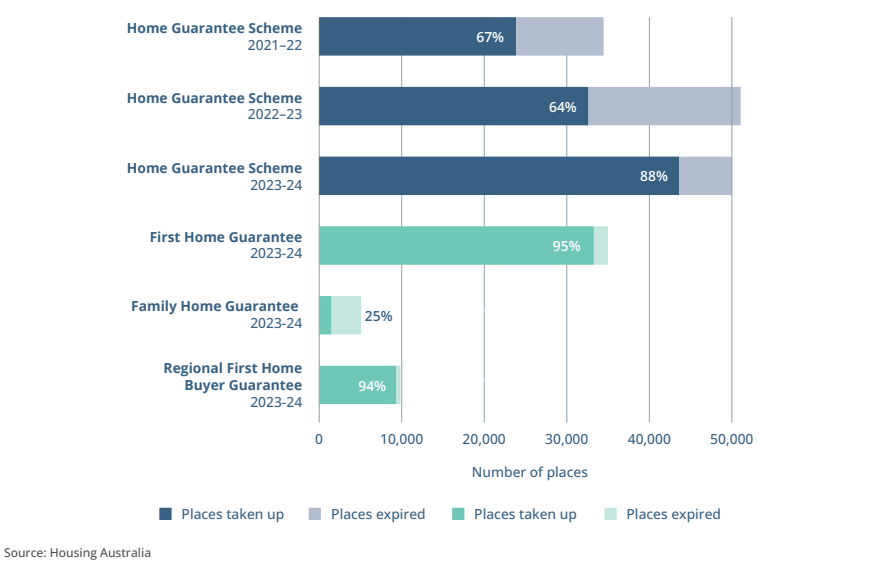
With a favourable tax regime and government policies encouraging people to take up homeownership, and a financial services sector heavily geared towards financing homeownership, there is strong evidence that the momentum on property prices will continue.
5. Supply and Demand characteristics
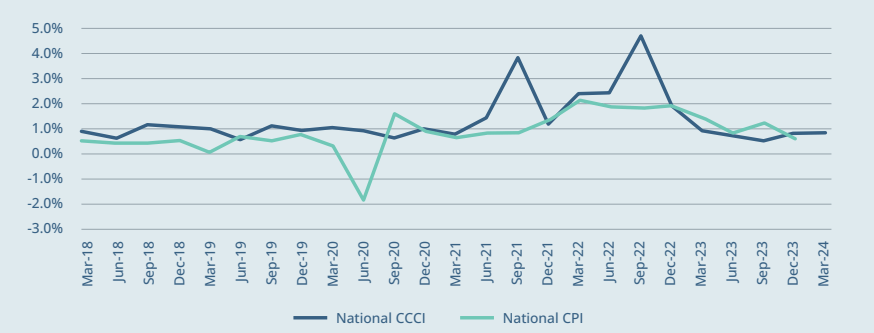
While growth in construction costs is normalising, input costs for building construction businesses have increased by 31% from September 2020 to June 202412.
Research from Altus Group concludes that energy intensive materials are expected to remain expensive, as geopolitical conflict impacts the cost and availability of EU imports.
On top of this, 90,000 extra construction workers are required to meet the government’s new home supply targets13.
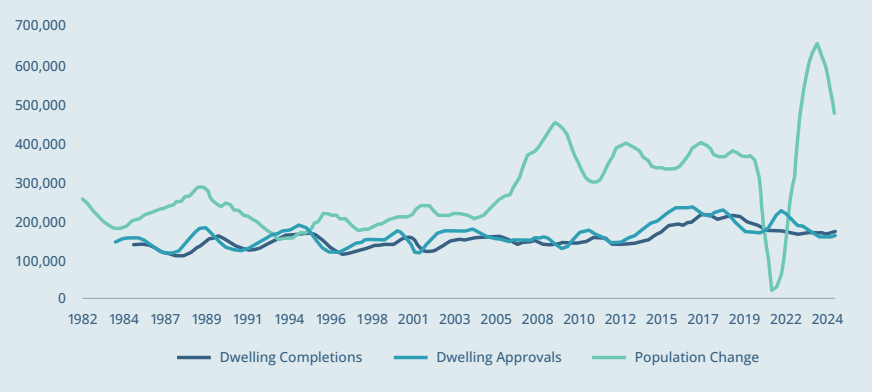
Put simply, supply is failing to meet demand. ABS data shows dwelling approvals and completions are failing to keep pace with Australia’s rising population.
Quarterly change in construction cost vs CPI, National
Dwelling Approvals, Completions and Population Growth (Rolling Annual)
Insights from RBA industry soundings note that some market participants have delayed projects because of the relatively high cost of building when compared with the project’s returns.
Household size reduction
There has been a noticeable reduction in the number of people that live in each home over the last forty years. Data from the RBA highlights that the average number of people living in each household has trended lower, from ~3.0 in the early 1980s to ~2.5 of late14.
Households shrinking over time
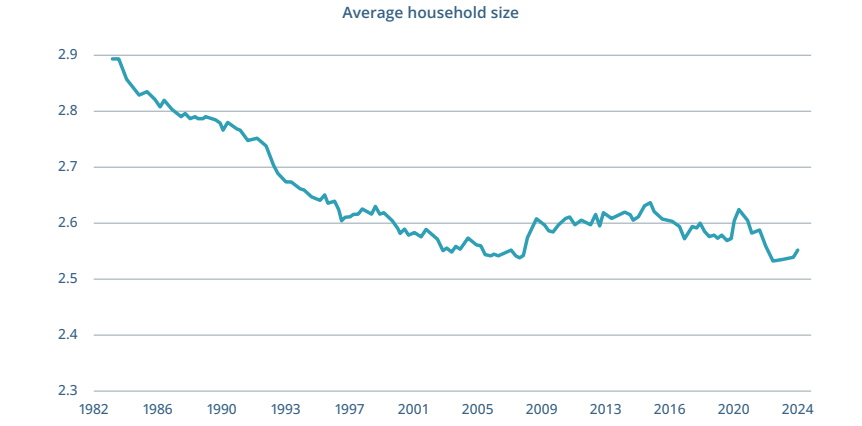
 This might seem like a small change. But the RBA’s own analysis has highlighted that if average household size rose back from 2.5 to 3.0 people per household, we would need 1.2 million fewer dwellings to house our current population.

Work From Home
The chart below highlights that more people are now working from home. During the pandemic, there was a shift in preferences towards more physical living space per person, which is understandable when lockdowns forced Australians to spend more time at home. Data from the RBA shows that 36 per cent of Australians now work from home regularly, compared to 32 per cent prior to the pandemic15.
While many commentators will be of the view that if the industry just delivers more homes each year (i) house price growth will dramatically slow, and (ii) the housing crisis will be resolved. It seems that the reality is much more nuanced.
More people now working from home
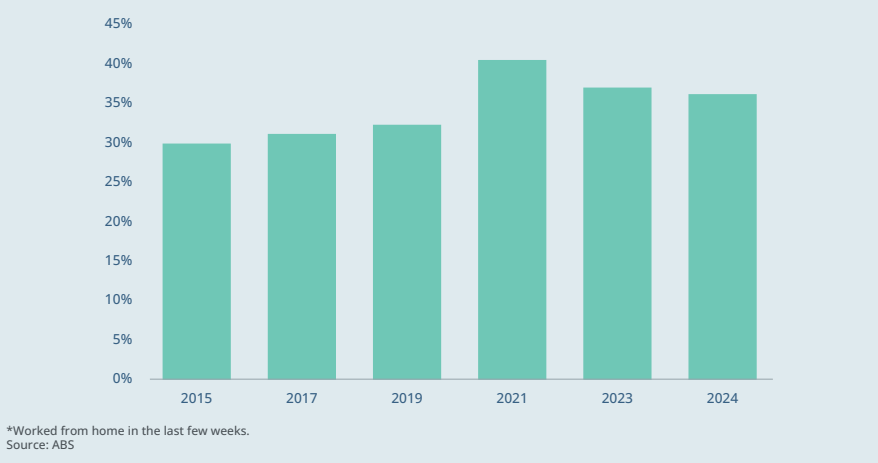
More people are working from home
Conclusion
Residential property as an asset class has strong long-term prospects, and the megatrends noted here are set to continue. HOPE will continue assessing these trends and will aim to capitalise on the investment opportunities shaping the future of Australian residential property.
Footnotes
This article in its entirety is prepared by HOPE Housing Fund Management Limited ACN 629 589 939 corporate authorised representative (number 001289514) of SILC Fiduciary Solutions Pty Ltd ACN 638 984 602 (AFS licence number 522145) (Investment Manager/Manager/Company/HOPE/HOPE Housing). This article represents the opinions of the Investment Manager and is the product of internal research and does not in any way constitute an invitation or offer in relation to any financial product. For more information, please refer to the Investor Disclaimer on our website. Past performance is not a reliable indicator of future performance. HOPE Fund I means HOPE Housing Investment Trust.
i HOPE means HOPE Housing Fund Management Ltd
1 CoreLogic Chart Pack – March 2025
2 Oxford Economics Australia
3 Australian National Accounts: National Income, Expenditure and Product December 2024
4 Labour Force Australia, March 2025
5 Lonergan Research
6 Australian Seniors Research, Ageing in the workforce – Media release, September 2021
7 National, State and territory population, September 2024
8 JBWere, January 2024
9 Digital finance analytics, Feb 2025 – ‘Bank of Mum and Dad’ increasingly used for mortgage repayments, living expenses – ABC News
10 AMP, Econosights – Australian Household Wealth, 2023 High household wealth holdings – AMP
11 Housing Australia, Federal Government Support & Help For Home Buyers | Housing Australia
12 Housing Australia, HGS Trends and Insights Report 2023-24
13 ABS, August 2024, Insights into Output of Building construction prices | Australian Bureau of Statistics
14 Buildskills Australia, ABC, March 2024
15 RBA – A New measure of Average Household Size – March 2023
16 ABS, Working arrangements, August 2024
17 HOPE Fund I means HOPE Housing Investment Trust
18 The CoreLogic Benchmark is derived using the ‘CoreLogic Hedonic Home Index reports’ for ‘All Dwellings’ in the Sydney market, since the HOPE Fund I portfolio inception date of 16 November 2022. This is the growth of residential real estate in the Sydney market. The detailed methodology of the CoreLogic Hedonic Home Index can be found on the CoreLogic Australia website.

